
What is the actual issue, AR6, CO2 and other GHG
The IPCC AR6 facts
This is the sixth report from this huge collaboration between most governments around the world. Obviously it helps to have 5 earlier reports to compare findings, it is a safety net that you have most twist and turns covered. It is a massive task to get several hundreds of highly skilled scientists to work together and agree upon their review of current scientific evidence. Divided in three main groups looking at physical science, Impacts/adaptations and mitigation (damage control). They have agreed upon a common language for degree of certainties etc to speak a common language, not that it is an easy read… almost 4000 pages LINK
The report is accepted, but still subject to final editing, so I will use the report for policy makers as it includes the main physical evidence that I would like to summarize here, the headline statements. They are quite often comparing decades to take out yearly differences, as it can actualy fluctuate quite a lot from year to year.
A. The Current State of the Climate
A.1 It is unequivocal that human influence has warmed the atmosphere, ocean and land. Widespread and rapid changes in the atmosphere, ocean, cryosphere and biosphere have occurred.
A.1.1 Observed increases in well-mixed greenhouse gas (GHG) concentrations since around 1750 are unequivocally caused by human activities.
So here it is clearly stated that humans are the main cause for this, you probably heard about the hockey stick effect, the graph for GHG is increasing a lot the last 200 years, it hasn’t increased this quick earlier so someone has to be blamed.
A.1.2 Each of the last four decades has been successively warmer than any decade that preceded it since 1850. Global surface temperature was 1.09 [0.95 to 1.20] °C higher in 2011–2020 than 1850–1900, with larger increases over land (1.59 [1.34 to 1.83] °C) than over the ocean (0.88 [0.68 to 1.01] °C).
A.1.3 The likely range of total human-caused global surface temperature increase from 1850–1900 to 2010–2019 is 0.8°C to 1.3°C, with a best estimate of 1.07°C. It is likely that well-mixed GHGs contributed a warming of 1.0°C to 2.0°C.
A.1.6 It is virtually certain that the global upper ocean (0–700 m) has warmed since the 1970s and extremely likely that human influence is the main driver. It is virtually certain that human-caused CO2 emissions are the main driver of current global acidification of the surface open ocean.
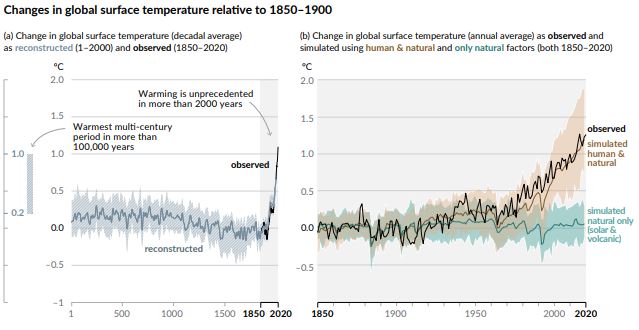
Here you see the hockey stick graph showing the short amount time the temperature has risen, this is the main concern for our climate, which habitat will be to adapt to this or not.
A.2.1 In 2019, atmospheric CO2 concentrations were higher than at any time in at least 2 million years (high confidence), and concentrations of CH4 and N2O were higher than at any time in at least 800,000 years (very high confidence). Since 1750, increases in CO2 (47%) and CH4 (156%) concentrations far exceed – and increases in N2O (23%).
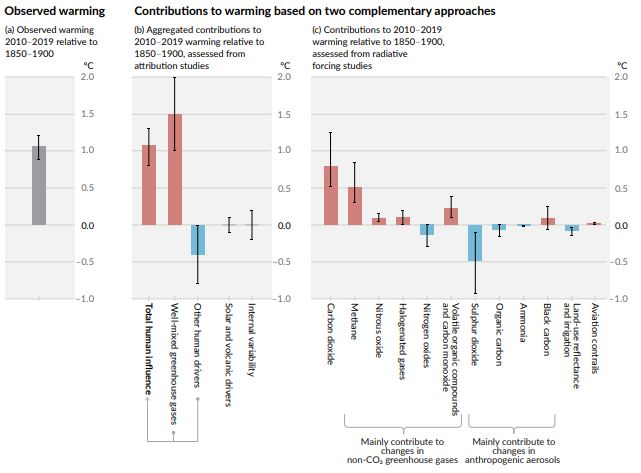
Here you see the main drivers for increased temp for the last decade, CO2 alone most likely more than 0,7C, Methane approx 0,5C, then several others around 0,1-0,2C. Then some contributing to a cooling effects, SO2/aerosols, but much less in total than warming.
A.2.3 In 2011–2020, annual average Arctic sea ice area reached its lowest level since at least 1850 (high confidence).
A.3 Human-induced climate change is already affecting many weather and climate extremes in every region across the globe. Evidence of observed changes in extremes such as heatwaves, heavy precipitation, droughts, and tropical cyclones, and, in particular, their attribution to human influence, has strengthened since AR5.
A.3.1 It is virtually certain that hot extremes (including heatwaves) have become more frequent and more intense across most land regions since the 1950s, while cold extremes (including cold waves) have become less frequent and less severe, with high confidence that human-induced climate change is the main driver14 of these changes.
A.3.2 The frequency and intensity of heavy precipitation events have increased since the 1950s over most land area for which observational data are sufficient for trend analysis (high confidence).
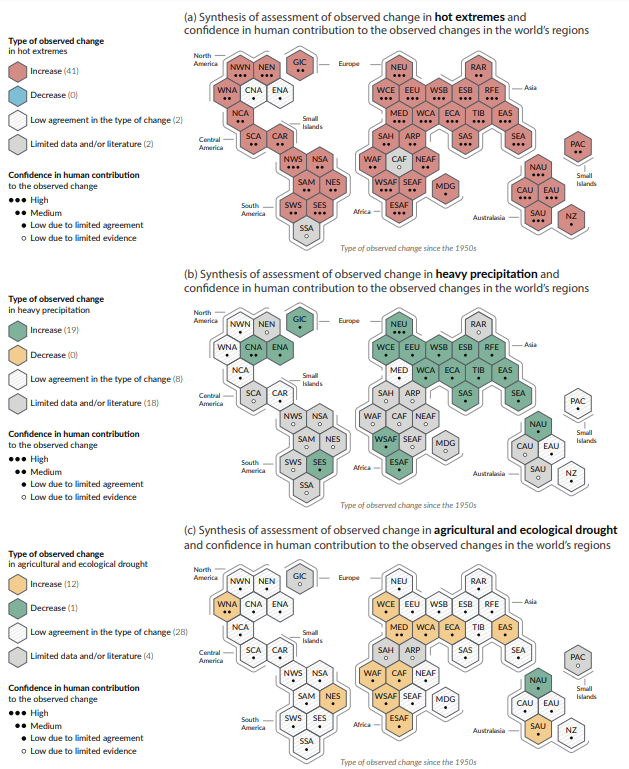
Maybe a bit too much, but quite important overview and I like the schematic set up, it is measurements since the 1950s, the left in each figure is north and south America, middle is Europe and Africa, to the right you find Russia, Asia and far right Aussie/AllBlacks…. Top one is for extreme hot weather, almost all regions in the world having it (red). Middle one talks about heavy rain, all green ones have had extreme rainfalls and bottom one talks about agricultural droughts (yellow increase).
Chapter A4 is about radiation
A.4.1 Human-caused radiative forcing of 2.72 [1.96 to 3.48] W m–2 in 2019 relative to 1750 has warmed the climate system. This warming is mainly due to increased GHG concentrations, partly reduced by cooling due to increased aerosol concentrations.
A.4.3 Heating of the climate system has caused global mean sea level rise through ice loss on land and thermal expansion from ocean warming. Thermal expansion explained 50% of sea level rise during 1971–2018, while ice loss from glaciers contributed 22%, ice sheets 20% and changes in land-water storage 8%
8 Replies to “What is the actual issue, AR6, CO2 and other GHG”
I’m gone to convey my little brother, that he should also visit this weblog
on regular basis to get updated from latest gossip.
Awesome blog you have here but I was curious if you knew of any message boards that cover the same topics discussed here?
I’d really love to be a part of community where I can get opinions from other knowledgeable
people that share the same interest. If you have any recommendations,
please let me know. Bless you!
freelocalsingles online dating sites for free 100% sex dating sites with no fees or subscription fees free dating sites chat
For hottest news you have to pay a quick visit web and on world-wide-web
I found this website as a best web site for newest updates.
Hey there! Do you know if they make any plugins to protect against hackers?
I’m kinda paranoid about losing everything I’ve worked hard
on. Any tips?
Bel article, je l’ai partagé avec mes amis.
If some one wishes to be updated with hottest technologies
then he must be visit this web page and be up to date daily.
Hey! I know this is somewhat off topic but I was wondering if you knew where I could find a captcha
plugin for my comment form? I’m using the same blog platform as yours and I’m
having difficulty finding one? Thanks a lot!